
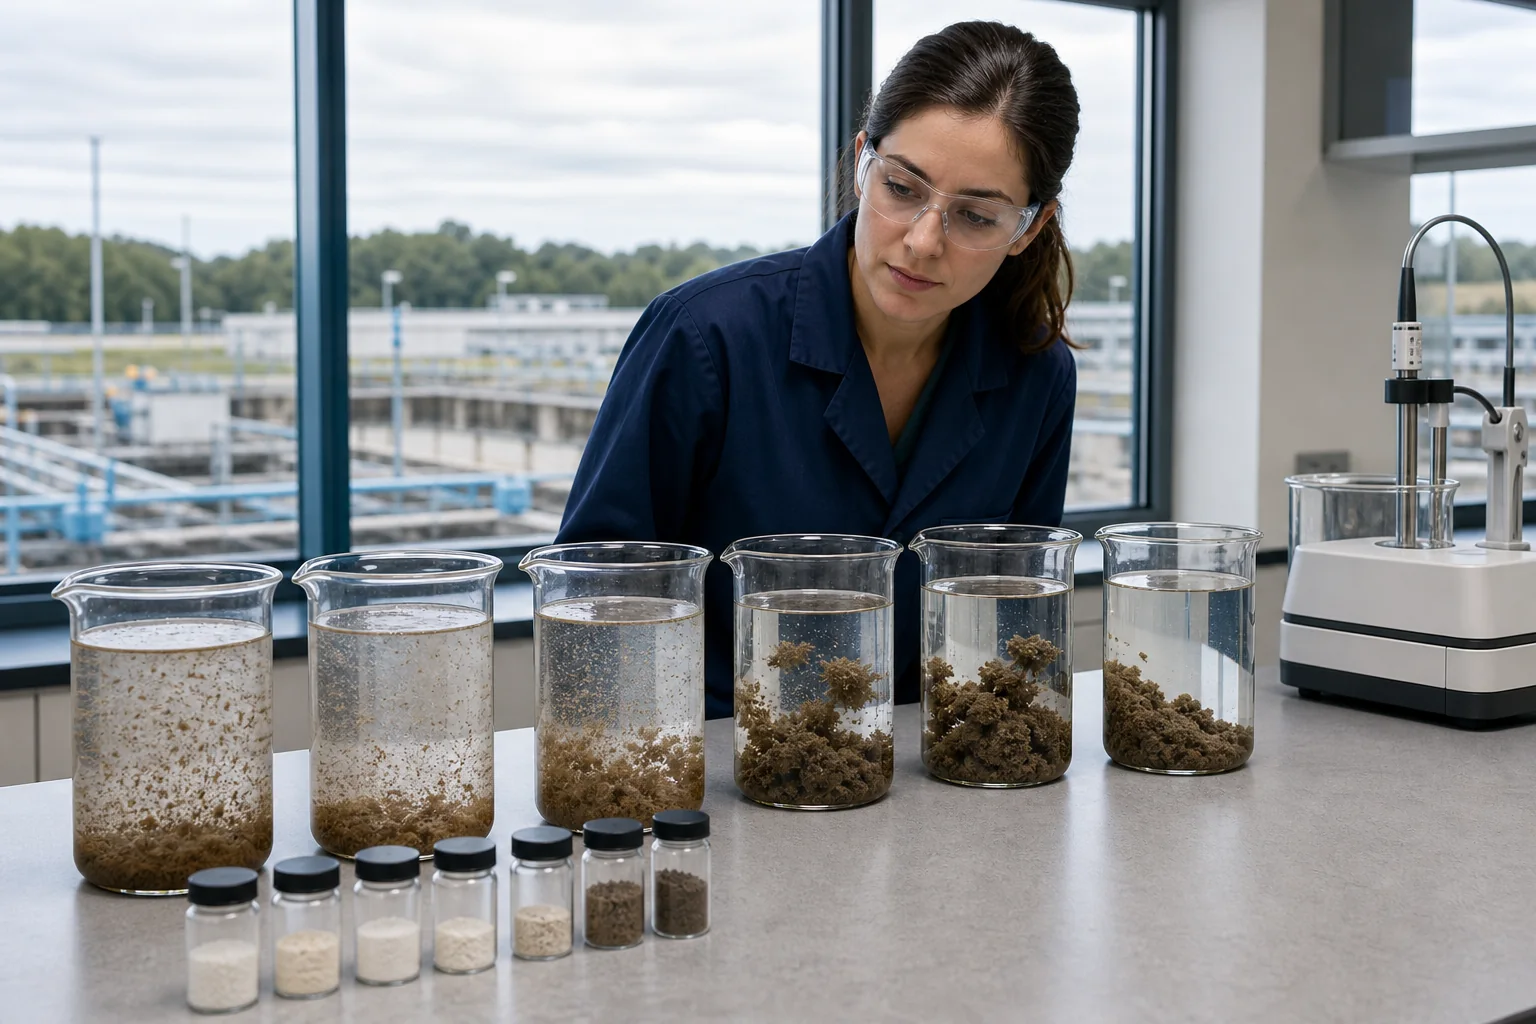
More cationic polyelectrolyte can improve capture up to a point and then reduce drainage or cake solids. Excess charge, saturated particle surfaces, viscous distribution zones and elastic water-retaining floc can all create an overdose response.
Recognize the field pattern
Possible symptoms include clearer centrate paired with wetter cake, sticky discharge, blinded cloth, slow gravity drainage, elastic floc, high torque or a result that improves and then reverses as dose rises. No single symptom proves overdose.
Check feed solids, process chemistry and machine settings before assigning cause. A dilute sludge can lower cake solids even when conditioning is unchanged.
Verify actual active dose
Measure feeder output, stock concentration, maturation, pump flow and sludge solids. Convert to active polymer per dry solids. A pump setpoint may deliver more product after calibration drift or when sludge concentration falls.
Inspect injection and dilution. Poor distribution can overdose part of the stream while leaving another part untreated.
Run a downward test
Hold sludge and equipment stable, then test lower active doses in planned steps. Wait through full residence before sampling. Record capture, centrate or filtrate, cake solids, throughput, torque or pressure and release.
If lower dose improves drainage without unacceptable solids loss, bracket the stable range and repeat. If all lower points fail, compare a different charge or molecular profile.
Prevent recurrence
Tie dose control to dry-solids loading where practical, recalibrate delivery and define alarm conditions for feed change. Preserve the dose curve and product lot with the operating record.
Set acceptance limits before testing
For an overdose diagnosis, define the feed range, baseline treatment and decision before polymer is added. State which sample represents normal operation and which represents the difficult condition. A candidate cannot be ranked fairly if sludge composition or machine settings change during the comparison.
Use a measurable endpoint: capture and cake solids together with drainage, centrate, torque or pressure. Record the method, sampling delay and instrument condition. Include a practical constraint such as throughput, torque, pressure, wash water, cycle time or downstream recycle load.
Bracket expected feed variation
Build at least two cases around normal and low feed solids, fresh and stored sludge, and stable versus upset chemistry. Run the same adjacent grades and active-dose steps on both. A broad controllable response is usually more useful than a narrow optimum on one easy sample.
Keep make-down water, concentration, wetting, maturation, solution age, dilution and mixing identical. If one condition must change, use a bridge comparison to separate the preparation effect from the sludge effect.
Read the full response curve
Plot blank, current product and candidate results against active dose per dry solids. Mark the first useful response, stable middle range and point where more addition stops helping or reverses performance. Repeat important middle and high points.
When more active dose produces a reversed performance slope or sticky water-rich floc, stop changing several variables together. Check sample integrity, upstream chemistry, stock solution, dose calculation, distribution and shear before moving to a different grade.
Carry the result into the machine
For scale-up, step dose downward with equipment fixed and wait through full residence before each sample. Wait for the full equipment and recycle residence after each change. Collect matched feed, liquid and cake samples and preserve the machine settings with the result.
Convert pump or feeder settings back to active product use and reconcile with inventory during a stable period. Differences can expose calibration, tank turnover, dilution or recirculation errors.
Close the technical and purchasing record
Retain product code, lot, preparation sheet, dose curve, photographs, readings and full-scale result. Define the feed range and change condition that requires retesting so the approved sample remains connected to the material later received.
Request COA, TDS and SDS for the exact grade. Compare packaging, freight, storage, make-down, active consumption and dewatering value as delivered treatment cost.